Last Updated on 12.09.2025 by hrushetskyy
Tire Tread Wear Marks And What To Look Out For To Avoid Tire-Related Crashes
Tire maintenance is a non-negotiable aspect of owning any vehicle. Well-maintained tires help people travel safely on the road, but neglected and poorly maintained ones spell trouble and accident.
The Fatality Analysis Reporting System or FARS in 2015 recorded 634 fatal tire-related motor vehicle crashes. This is why, before they fail, car owners should be responsible to inspect the tread wear marks regularly. The sheer volume of casualties from tire-related accidents on the roads already speaks a lot of the importance of keeping tabs of the tire’s tread wear marks.
So, how should you maintain your tire? It’s simple. You should educate yourself in proper car maintenance and not rely so much on looking out for a house of tires in Reading, Pennsylvania (PA) for hours just to have somebody else figure everything out for you. You might have been looking out for tire places in North Reading, MA too. Or probably tire stores near Reading, MA (Massachusetts). But knowing the basics of tire maintenance will teach you a lot and might help in keeping your family safe.
Every driver should learn reading tire sidewall codes. It is similar to reading tire sidewall information which explains a lot about your car’s tires. Here are the most important things you should learn about once you decide to drive a car:
- How to read car tires sizes;
- How to read numbers on tires like the load capacity and recommended air pressure;
- Know about tires expiration and how to read it; and
- Know when to buy new tires by the looks of the tread depth.
Being familiar with the basics of tire maintenance is crucial in order to avoid accidents brought by poorly-maintained tires.
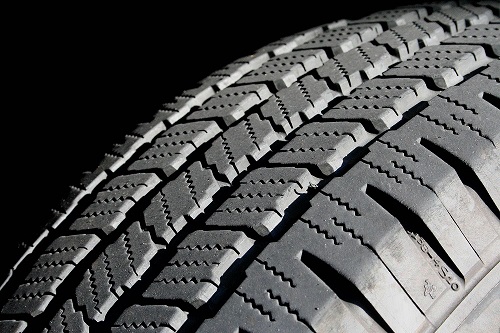
How much tread is supposed to be on a tire?
Tread depth is the measurement between the top and the bottom of the tire’s rubber pattern. Monitoring your depth of tread is a good way to avoid an accident. You may measure the depth of tread with a gauge or the penny test. Neglecting the minimum required depth might cause you an accident. and it’s also important to know when to rotate tires to ensure even tread wear Here’s what you could use as a guide:
| Tread depth | Remarks |
| 4/32” or deeper | Good |
| 3/32” | Replace your tires soon |
| 2/32” | Replace your tires immediately |
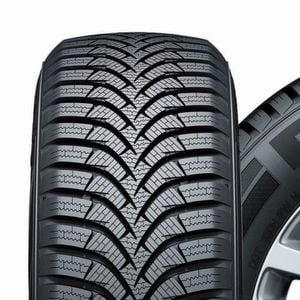
What are tired tread wear indicators?
Tires designed for different seasons often come equipped with tread wear indicators (TWI). Commonly found on newer tires, these built-in bars become more visible as the tread wears down. They serve as a visual cue, alerting drivers when it’s time to replace their tires for optimal safety and performance.
National Statistics on Tire-Related Crashes
Studies show that tire problems could affect the outcome of road accidents. Between 2005 and 2007, nine percent of almost 2.1 million vehicles that were involved in car crashes were reportedly caused by tire issues. The Insurance Institute for Highway Safety recorded 37,461 fatalities from motor vehicle crashes in 2016.
In the same year, 34,439 fatal motor vehicle crashes occurred. The table below presents the total tally of 11.6 deaths per 100,000 people in the United States and 1.16 deaths were recorded per 100 million miles traveled by motorists.
In Pennsylvania, there were 9.3 deaths recorded per 100,000 population and 1.16 deaths were recorded per 100 million miles a vehicle traveled. The figures are very close to the national statistics. Meanwhile, Massachusetts recorded a slightly lower figure of 5.7 deaths per 100,000 population and 0.66 deaths per 100 million miles traveled.
The same study found out that 563 drivers were killed in Pennsylvania due to car crashes, while 187 drivers were killed in Massachusetts. The total numbers of drivers killed in the United States that year reached 17,548.
|
Population, fatal motor vehicle crashes, motor vehicle crash deaths and motor vehicle crash death rates per state, 2016 |
||||||
|
State |
Population | Vehicle miles traveled (millions) | Fatal crashes | Deaths | Deaths per 100,000 population |
Deaths per 100 million vehicle miles traveled |
|
Alabama |
4,863,300 | 69,553 | 937 | 1,038 | 21.3 | 1.49 |
| Alaska | 741,894 | 5,030 | 78 | 84 | 11.3 | 1.67 |
| Arizona | 6,931,071 | 66,859 | 865 | 962 | 13.9 | 1.44 |
| Arkansas | 2,988,248 | 36,093 | 488 | 545 | 18.2 | 1.51 |
| California | 39,250,017 | 366,402 | 3,357 | 3,623 | 9.2 | 0.99 |
| Colorado | 5,540,545 | 52,993 | 558 | 608 | 11.0 | 1.15 |
| Connecticut | 3,576,452 | 31,987 | 281 | 293 | 8.2 | 0.92 |
| Delaware | 952,065 | 10,146 | 116 | 119 | 12.5 | 1.17 |
| District of Columbia | 681,170 | 3,553 | 26 | 27 | 4.0 | 0.76 |
| Florida | 20,612,439 | 220,083 | 2,933 | 3,174 | 15.4 | 1.44 |
| Georgia | 10,310,371 | 120,569 | 1,422 | 1,554 | 15.1 | 1.29 |
| Hawaii | 1,428,557 | 11,610 | 109 | 120 | 8.4 | 1.03 |
| Idaho | 1,683,140 | 17,677 | 232 | 253 | 15.0 | 1.43 |
| Illinois | 12,801,539 | 109,208 | 1,003 | 1,082 | 8.5 | 0.99 |
| Indiana | 6,633,053 | 83,322 | 768 | 821 | 12.4 | 0.99 |
| Iowa | 3,134,693 | 32,325 | 356 | 404 | 12.9 | 1.25 |
| Kansas | 2,907,289 | 32,122 | 381 | 429 | 14.8 | 1.34 |
| Kentucky | 4,436,974 | 49,491 | 763 | 834 | 18.8 | 1.69 |
| Louisiana | 4,681,666 | 49,468 | 704 | 757 | 16.2 | 1.53 |
| Maine | 1,331,479 | 14,979 | 151 | 161 | 12.1 | 1.07 |
| Maryland | 6,016,447 | 58,484 | 472 | 505 | 8.4 | 0.86 |
| Massachusetts | 6,811,779 | 59,004 | 359 | 389 | 5.7 | 0.66 |
| Michigan | 9,928,300 | 104,814 | 980 | 1,064 | 10.7 | 1.02 |
| Minnesota | 5,519,952 | 59,620 | 357 | 392 | 7.1 | 0.66 |
| Mississippi | 2,988,726 | 42,285 | 628 | 690 | 23.1 | 1.63 |
| Missouri | 6,093,000 | 75,713 | 868 | 945 | 15.5 | 1.25 |
| Montana | 1,042,520 | 13,181 | 171 | 190 | 18.2 | 1.44 |
| Nebraska | 1,907,116 | 20,818 | 194 | 218 | 11.4 | 1.05 |
| Nevada | 2,940,058 | 27,009 | 303 | 328 | 11.2 | 1.21 |
| New Hampshire | 1,334,795 | 13,510 | 130 | 136 | 10.2 | 1.01 |
| New Jersey | 8,944,469 | 76,941 | 569 | 601 | 6.7 | 0.78 |
| New Mexico | 2,081,015 | 26,348 | 358 | 402 | 19.3 | 1.53 |
| New York | 19,745,289 | 136,626 | 965 | 1,025 | 5.2 | 0.75 |
| North Carolina | 10,146,788 | 115,395 | 1,348 | 1,450 | 14.3 | 1.26 |
| North Dakota | 757,952 | 10,176 | 102 | 113 | 14.9 | 1.11 |
| Ohio | 11,614,373 | 119,046 | 1,053 | 1,132 | 9.7 | 0.95 |
| Oklahoma | 3,923,561 | 48,837 | 624 | 683 | 17.4 | 1.40 |
| Oregon | 4,093,465 | 37,492 | 446 | 495 | 12.1 | 1.32 |
| Pennsylvania | 12,784,227 | 102,775 | 1,088 | 1,188 | 9.3 | 1.16 |
| Rhode Island | 1,056,426 | 7,766 | 48 | 51 | 4.8 | 0.66 |
| South Carolina | 4,961,119 | 54,025 | 936 | 1,015 | 20.5 | 1.88 |
| South Dakota | 865,454 | 9,636 | 103 | 116 | 13.4 | 1.20 |
| Tennessee | 6,651,194 | 77,657 | 966 | 1,041 | 15.7 | 1.34 |
| Texas | 27,862,596 | 263,414 | 3,407 | 3,776 | 13.6 | 1.43 |
| Utah | 3,051,217 | 30,038 | 259 | 281 | 9.2 | 0.94 |
| Vermont | 624,594 | 7,325 | 57 | 62 | 9.9 | 0.85 |
| Virginia | 8,411,808 | 84,602 | 722 | 760 | 9.0 | 0.90 |
| Washington | 7,288,000 | 61,880 | 504 | 537 | 7.4 | 0.87 |
| West Virginia | 1,831,102 | 19,620 | 250 | 269 | 14.7 | 1.37 |
| Wisconsin | 5,778,708 | 63,575 | 544 | 607 | 10.5 | 0.95 |
| Wyoming | 585,501 | 9,595 | 100 | 112 | 19.1 | 1.17 |
| U.S. total | 323,127,513 | 3,220,677 | 34,439 | 37,461 | 11.6 |
1.16 |
Source: Insurance Institute For Highway Safety
How much tread is supposed to be on a tire?
Tread depth is the measurement between the top and the bottom of the tire’s rubber pattern. Monitoring your depth of tread is a good way to avoid an accident. You may measure the depth of tread with a gauge or the penny test. Neglecting the minimum required depth might cause you an accident.
Before you go to any house of tires in Reading, PA, and spend hours of figuring out what could be done to conduct a proper tire maintenance, familiarize yourself on how to assess your tire’s tread depth regularly. Here’s what you could use as a guide:
|
Tread depth |
Remarks |
| 4/32” or deeper |
Good |
| 3/32” |
Replace your tires soon |
| 2/32” |
Replace your tires immediately |
A study conducted by the National Highway Traffic Safety Administration (NHTSA) previously analyzed the crash-data from 2005 to 2007. The study found out that tire-related crashes are more likely to occur when the tire’s tread wear.
Tires with a full tread depth got 2.4 accident rate, while those with a tread depth of 0-2/32” got 26 percent accident rate. Here are things to look out for when you are inspecting for tire tread wear marks:
- Inspect the depth of tread – You may check whether the depth of tread is still good or should be replaced right away through a penny test. Insert a Lincoln penny and when you see a large part of the coin is visible, the tread might already be about 2/32 inches. Remember that the depth of tread should never fall below 1/16 of an inch or 1.6 millimeters.
- Check the tire for any cuts and bumps on the sidewall – Check the entire surface of the tire for any crack, cut, or bump.
- Bead area damage – The inner circle of the tire that connects the tire to the wheel and holds it together is called the bead area. If you see missing rubber parts or any damage on that area, your tire is unsafe to use.
- Aging tire – Aside from knowing how to read tire tread wear marks, car owners should know how to read numbers on car tires. For instance, a driver should be familiar that there is such a thing as tires expiration and should know how to read it. The tire manufacturing date is shown in the last four numbers on the tire. The first two numbers indicate the week when the tire was made and the last two digits represent the year. For example, a tire with a DOT code of 1309 was made in the 13th week of 2009.
- Excessive vibration while on the road – If you feel any irregular or excessive vibrations while you are driving, you may check out tire stores near Reading, MA or in Reading, PA depending on your location. Irregular vibrations are easy to spot as you feel sudden movements even when you are running on good road surfaces.
- outside edge wear – Apart from general tread wear marks, you should also inspect for outside edge wear, which can indicate alignment issues or improper tire inflation.
How Does Tire Pressure Affect Tread Wear?
Drivers should always check their car’s tire pressure to prevent uneven tire wearing and failure. The NHTSA’s study found out that underinflation of tires poses three times the risk of getting involved in a car crash. Underinflated tires of up to 25 percent are also prone to overheating that might lead to steering failure.
The NHTSA’s study looked at the data during the time when tire-pressure monitoring systems weren’t required yet on all vehicles. It showed that five percent of all vehicles that were studied experienced tire problems immediately before a crash. Sixty-six percent of the vehicles are passenger cars, 17 percent are SUVs and the remaining are vans and pick-ups.
Can You Replace Your Tires With Used Tires?
You could replace your tires with used tires but there are certain conditions, although you don’t have to know how to read tire tread wear marks because that job is reserved for experts. Unlike new tires, used tires near Reading, PA or used tires in Reading, MA, is not anymore subject to any legal standard or inspection process. It will come at a much cheaper price, however, used tires also have several disadvantages.
How To Read You Tire Sidewall
Tires manufactured after 2000 already have four-digit DOT code. The last two digits is the week and the next two is the year. But there is more to tires than it’s manufacturing date. Tire sidewalls also contain numbers and letters that tell you the following:
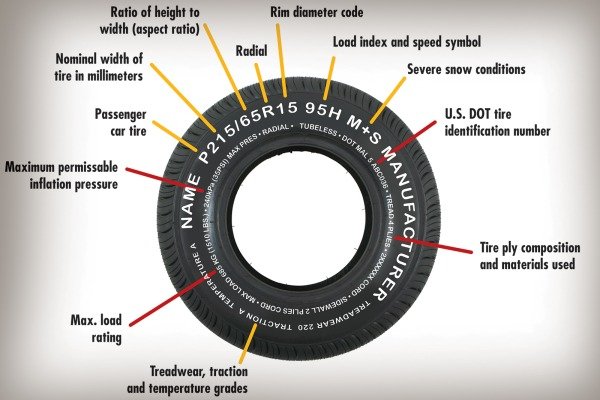
- Type of the tire. Each type of tire comes with capacity and limitation. If the tire does not come with a letter, it could be a metric-sized tire. Here are various types of tire letter markings that indicate the service type.
- P – The tire is for P-metric passenger vehicles. These include regular cars, SUVs, light-duty pickups with ¼-½ ton load capacities.
- LT – The tire is for light trucks. These include some SUVs, medium and heavy-duty pickups with ¾-1 ton load capacities.
- ST – Stands for a special trailer tire used on utility, car, and boat trailers.
- T – Also known as temporary (spare) tire which can be used until the repair or replacement of the main tire completed.
- C – Euro-metric sizes with C indicates that the tire is for commercial use.
- M – M indicates that the tire is for motorcycles.
2. Width – The width is measured to show the distance from the inner sidewall to the outer sidewall. The tire’s first number shows the width in millimeters. The width varies depending on the rim.
3. The height of its sidewall or the aspect ratio – After the width, the tire’s next two numbers on the sidewall will show the height of the sidewall in the percentage of the width. As the tire ratio increases so do the height and size of the sidewall. The aspect ratio determines the smoothness of the ride. Vehicles with higher tire aspect ratio provide smoother rides.
4. Construction – Tire markings also indicate whether the tire is made via radial type or bias-belted and diagonal bias construction.
- R – Radial tires, also called radial-ply tires, consist of layers of fabric like polyester and/or nylon plies that cover the circumference of the tires.
- B – Belted-bias tires have belts made of steel and offers more support. These are preferred by those who own classic cars.
- D – Diagonal bias tires have a series of tire plies layered diagonally.
5. Size of the wheel where it fits – The number shows after the type of tire construction letter, indicates the size of the rim where it fits. Tires will only fit a wheel with its similar inner diameter.
6. Load capacity and speed rating – The load index and speed rating are displayed after the size of the wheel. Depending on the number written on the tire’s sidewall, you may use the guide for the load carrying capacity of the vehicle using the table below:
| Load Index | Pounds | Kilograms | Load Index | Pounds | Kilograms | Load Index | Pounds | Kilograms | ||
| 70 | 739 | 335 | 89 | 1279 | 580 | 108 | 2205 | 1000 | ||
| 71 | 761 | 345 | 90 | 1323 | 600 | 109 | 2271 | 1030 | ||
| 72 | 783 | 355 | 91 | 1356 | 615 | 110 | 2337 | 1060 | ||
| 73 | 805 | 365 | 92 | 1389 | 630 | 111 | 2403 | 1090 | ||
| 74 | 827 | 375 | 93 | 1433 | 650 | 112 | 2469 | 1120 | ||
| 75 | 853 | 387 | 94 | 1477 | 670 | 113 | 2535 | 1150 | ||
| 76 | 882 | 400 | 95 | 1521 | 690 | 114 | 2601 | 1180 | ||
| 77 | 908 | 412 | 96 | 1565 | 710 | 115 | 2679 | 1215 | ||
| 78 | 937 | 425 | 97 | 1609 | 730 | 116 | 2756 | 1250 | ||
| 79 | 963 | 437 | 98 | 1653 | 750 | 117 | 2833 | 1285 | ||
| 80 | 992 | 450 | 99 | 1709 | 775 | 118 | 2910 | 1320 | ||
| 81 | 1019 | 462 | 100 | 1764 | 800 | 119 | 2998 | 1360 | ||
| 82 | 1047 | 475 | 101 | 1819 | 825 | 120 | 3086 | 1400 | ||
| 83 | 1074 | 487 | 102 | 1874 | 850 | 121 | 3197 | 1450 | ||
| 84 | 1102 | 500 | 103 | 1929 | 875 | 122 | 3307 | 1500 | ||
| 85 | 1135 | 515 | 104 | 1984 | 900 | 123 | 3417 | 1550 | ||
| 86 | 1168 | 530 | 105 | 2039 | 925 | 124 | 3527 | 1600 | ||
| 87 | 1201 | 545 | 106 | 2094 | 950 | 125 | 3638 | 1650 | ||
| 88 | 1235 | 560 | 107 | 2149 | 975 | 126 | 3748 | 1700 |
(Table: Load Index Chart)
| Rating | Maximum Speed |
| Q | 100 MPH |
| S | 112 MPH |
| T | 118 MPH |
| U | 124 MPH |
| H | 130 MPH |
| V | 149 MPH |
| W | 168 MPH |
| Y | 186 MPH |
| Z | Over 149 MPH |
Meanwhile, the speed rating has a different chart and it shows an English alphabet letter that has a corresponding maximum speed that the tire can sustain when it is carrying the recommended load capacity.
Share the KnowledgeRelated posts:
What kinds of tires do I need for my motorcycle
Studded Tires and Winter Driving Conditions: Make Your Conscious Choice
Stay Balanced: How to Know If Your Motorcycle Tire Needs Balancing
How Long Dunlop Motorcycle Tires Last? Expert Insights & Maintenance Tips
5 Safe Driving Apps and Tools to Minimize Distractions